The graphical user interface manages the complete user interaction. It supports specification of HQPN models and analysis tasks. It offers a selection of analysis algorithms and performance measures to be calculated and presents results of qualitative and quantitative analysis.
A hierarchical model description consists of two different types of nets: a HLQPN and LLQPNs, which may or may not contain LLQPNs themselves. We give a brief description of a hierarchical model specification process starting with the HLQPN:
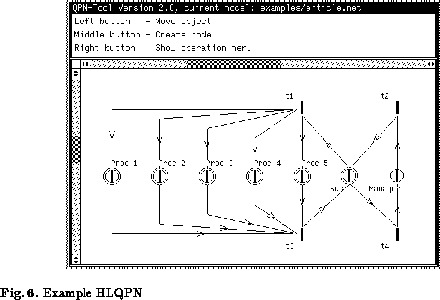
1. The graphical description is clearly dominated by its coloured Petri net part. This part is specified by creating and positioning places and transitions and establishing their connections by directed arcs. Figure 6 shows an example HLQPN. Here all transitions are immediate and all places are subnet places except for the place Manager which is a timed place.
2. Attributes of places and transitions have to be set. This includes entering the different colours in a list, choosing the type of transitions and places (timed or immediate, resp. timed, subnet or ordinary) and fixing the number of tokens for the initial marking. Timed and subnet places require additional information. For these places, the user has to specify performance figures to be determined in quantitative analysis (cf. Sect. 3.2). In case of a timed place, the scheduling strategy and number of servers must be chosen. Presently available scheduling strategies are Random, PS, Infinite Server (IS) and Priorities. For each colour, the service time distribution is specified by its mean and coefficient of variation, which is then approximated by a Cox distribution. In case of a subnet place, the corresponding subnet specification (see 4. below) has to be given.
3. The incidence functions of the coloured Petri net (cf. [13]) have to be specified. This is possible at each transition of a graphical submodel. Such a submodel describes the locally unfolded net regarding a single transition and its input and output places. A special feature of QPN-Tool fills the submodel automatically with the transition's colours and all input and output places including all of their colours. Thus only arcs and their weights have to be specified manually. This kind of specification remains unchanged from version 1.0, see [4] for more details.
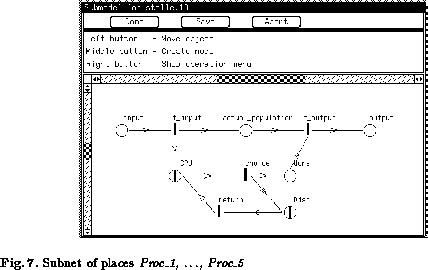
4. The specification of subnet places follows the same steps as the specification for the HLQPN. Similar to the local unfolding of a transition QPN-Tool automatically fills the subnet with the dedicated input and output places and input and output transitions (Fig. 7, see also t_input and t_output in Fig. 2). The ordinary place actual_population is also inserted automatically.
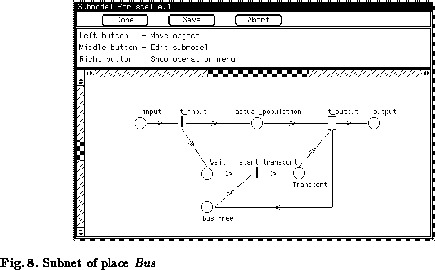
The automatically generated subnet can be extended by the user to a complete HQPN itself (cf. the user specified part in Fig. 2). The corresponding specification mechanisms are identical to the ones of the former described HLQPN.
![]()
![]()
![]()
![]()
![]()
![]()
In order to simplify the utilisation of a subnet specification for different
places, QPN-Tool allows to declare an `external' subnet by a filename.
If the subnet contained in this file has input/output places with
colour sets different from the colour set of the subnet place, the
colours are matched by order of appearance in the colour lists. This
matching is brute-force, but from a user's point of view it is easy
and convenient to use. Figure 7 shows a subnet of
Proc_1 which is re-used for subnet places Proc_2,
 , Proc_5 in Fig. 6.