


Next: Analysis techniques
Up: QPN-Tool
Previous: QPN-Tool
The graphical user interface manages the complete user interaction.
It supports:
- specification of QPN models,
- specification of analysis tasks, selection of analysis
algorithms and required performance measures,
- presentation of results concerning classification of QPNs and
results of qualitative and quantitative analysis
- aggregation of detailed information on probably undesired net
properties, e.g. brief description of a firing sequence which leads to
a deadlock.
The model description process consists of several main steps.
The net's graphical representation is clearly dominated by the
Coloured Petri net part. This part is specified by creating and
positioning places and transitions and establishing their connections
by directed arcs. Figure 3 shows the net
corresponding to Example 1.
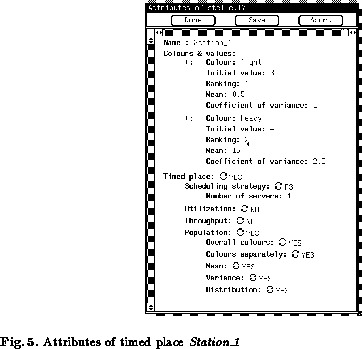
Attributes of places and transitions have to be set. This includes
entering the different colours in a list, choosing the type of
transitions and places (timed or immediate, resp. timed or ordinary)
and fixing the number of tokens for the initial marking. Especially
timed places require some additional information:
- for each colour
- its rank according to bulk arrivals
- its service time distribution specified by its mean and
coefficient of variance. This service time distribution is
approximated by a Cox distribution as described in [8].
- scheduling strategy
Presently available scheduling
strategies are FCFS, LCFS-Pr, PS and Infinite Server (IS).
- number of servers
- performance figures
to be determined in quantitative analysis (cf. Sec. 3.2.4).
Figure 5 displays attributes for Station_1
of example 1.

The incidence functions of the Coloured Petri net (cf. [10])
have to be specified. This is possible in a graphical submodel at
each transition. Such a submodel describes the locally unfolded net
regarding a single transition and its input and output places. A
special feature of QPN-Tool fills the submodel automatically with the
transition's colours and all input and output places including all of
their colours. Thus only arcs and their weights have to be specified
manually.
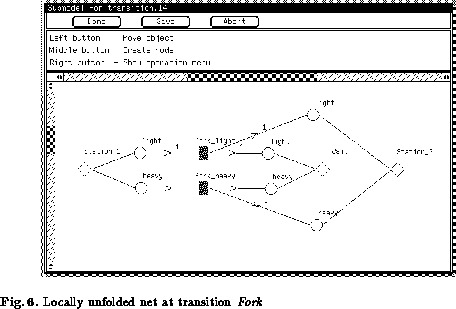
Figure 6 shows the submodel of transition Fork in
Fig. 3. A rhomb represents a coloured place. Colours
of a place are represented by circles which are connected to its
corresponding place by lines. Bars display colours of the transition
whose submodel is regarded. Obviously transition colour `fork_light'
takes one `light' token from place `Station_1' and puts on places
`Wait' and `Station_2' one token on each of the corresponding colour `light'.
Transition colour `fork_heavy' does the same for `heavy' tokens.
Locally unfolding a net has certain advantages:
- It allows a detailed view on single active components with
their corresponding environments.
- The Petri-net-type formalism in locally unfoldings and the whole
net is homogeneous.
- Automatic generation of graphical objects in a local unfolding
supports a convenient specification.
- Furthermore generating available colours of input/output
places as well as transition colours automatically avoids
inconsistent specifications, because the set of colours which can be
used and should be used are presented completely. Default positions
reflect the common reading direction: input places and their colours
to the left, transition colours in the middle, output places and
their colours to the right.
- If several transitions have identical submodels, it is
sufficient to specify just one. Sharing a submodel is possible as
well as copying it.
Since locally unfolding is used within QPN-Tool, it combines a
comfortable description technique with a clear presentation.
Next: Analysis techniques
Up: QPN-Tool
Previous: QPN-Tool